
Introduction
Technical analysis strategies have become an essential part of modern trading. Whether someone trades stocks, cryptocurrencies, forex, or commodities, understanding market trends can help improve decision-making. Instead of relying on emotions or random guesses, traders use charts, patterns, and indicators to identify possible market movements.
In recent years, technical analysis strategies have gained popularity because online trading platforms are more accessible than ever. Beginners can now study charts on their phones, while experienced traders use advanced tools to refine their market entries and exits. However, success in trading does not come from luck alone. It requires discipline, planning, patience, and the ability to analyze market behavior correctly.
Technical analysis focuses mainly on price action and market psychology. The core belief is that all available information is already reflected in the price. By studying past market behavior, traders attempt to predict future price movements. Although no strategy guarantees profits every time, the right approach can reduce risks and improve consistency.
This guide explains technical analysis strategies in a simple and practical way. It covers important concepts, trading methods, indicators, benefits, risks, mistakes to avoid, and expert-level advice. Whether you are a beginner learning the basics or an intermediate trader looking to improve your skills, this article will help you understand how technical analysis works in real trading environments.
What is Technical Analysis Strategies?
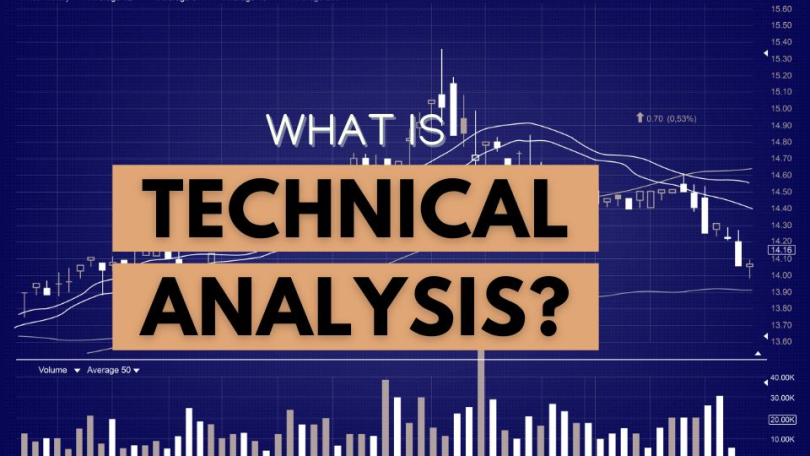
Technical analysis strategies refer to methods traders use to evaluate and predict market movements by studying price charts, trading volume, trends, and indicators. Instead of focusing on company financial reports or economic data, technical analysis mainly studies how prices move over time.
The idea behind technical analysis is simple. Markets often move in patterns because trader behavior tends to repeat itself. Fear, greed, excitement, and panic influence buying and selling decisions. As a result, chart patterns and trends appear repeatedly in different markets.
Technical analysis strategies usually involve several important tools:
- Price charts
- Support and resistance levels
- Trend lines
- Moving averages
- Candlestick patterns
- Volume analysis
- Technical indicators
For example, if a stock repeatedly stops falling near a certain price level, traders may consider that area as support. Similarly, if the price struggles to move higher beyond a certain point, it becomes resistance.
Traders combine these tools to create strategies for entering and exiting trades. Some focus on short-term trading, while others prefer long-term trend analysis.
There are also different chart types used in technical analysis:
- Line Charts
- Bar Charts
- Candlestick Charts
Among these, candlestick charts are the most popular because they provide detailed information about price movement within a specific timeframe.
Technical analysis strategies are used in:
- Stock trading
- Forex trading
- Cryptocurrency trading
- Commodity trading
- Index trading
Although the market conditions differ, the principles of technical analysis remain mostly the same.
Why is Technical Analysis Strategies Important?
Technical analysis strategies are important because they help traders make more informed decisions. Financial markets move quickly, and emotional trading often leads to losses. A structured strategy provides clarity and discipline.
One major advantage is that technical analysis works across different markets. A trader who understands chart patterns in stocks can often apply similar concepts to cryptocurrencies or forex markets.
Another important factor is timing. Fundamental analysis may identify strong investments, but technical analysis helps traders decide when to buy or sell. This timing advantage can significantly improve trade execution.
Technical analysis strategies are also valuable because they:
- Help identify market trends
- Improve entry and exit timing
- Reduce emotional decision-making
- Assist with risk management
- Provide measurable trading rules
- Support short-term and long-term trading
For example, a trader may notice that a currency pair consistently respects a moving average line during an uptrend. Instead of buying randomly, the trader waits for the price to return near the moving average before entering the trade.
Technical analysis also helps traders manage risks better. Stop-loss levels, position sizing, and trend confirmation reduce the chances of large losses.
Additionally, many professional traders use technical analysis strategies because markets are heavily influenced by psychology. Charts reflect collective market sentiment, making them powerful tools for analyzing trader behavior.
Without a strategy, traders often react emotionally to news, fear, or hype. Technical analysis creates a structured framework that encourages disciplined trading decisions.
Detailed Step-by-Step Guide
Step 1: Understand Market Trends
The first step in technical analysis is identifying the market trend. Prices generally move in three directions:
- Uptrend
- Downtrend
- Sideways trend
An uptrend occurs when prices make higher highs and higher lows. A downtrend forms when prices create lower highs and lower lows. Sideways markets move within a range without a clear direction.
Trading with the trend is usually safer than trading against it. Many beginners lose money because they try to predict reversals too early.
Trend lines can help traders visualize market direction. Drawing lines across swing highs or lows often reveals the overall trend.
Step 2: Learn Support and Resistance
Support and resistance levels are critical in technical analysis strategies.
Support is an area where buying pressure may stop prices from falling further. Resistance is an area where selling pressure may stop prices from rising.
These levels are important because traders often make decisions around them.
For example:
- Buying near support may provide a favorable risk-to-reward ratio.
- Selling near resistance can help lock profits.
- Breakouts above resistance may signal bullish momentum.
Strong support and resistance levels often form due to repeated market reactions.
Step 3: Use Moving Averages
Moving averages smooth out price data and help traders identify trends.
The two common types are:
- Simple Moving Average (SMA)
- Exponential Moving Average (EMA)
Short-term moving averages react faster to price changes, while long-term averages provide broader trend direction.
A popular technical analysis strategy involves moving average crossovers.
For instance:
- When a short-term average crosses above a long-term average, it may signal a buying opportunity.
- When it crosses below, it may signal weakness.
Many traders use the 50-day and 200-day moving averages for long-term analysis.
Step 4: Analyze Candlestick Patterns
Candlestick patterns reveal market sentiment.
Popular bullish patterns include:
- Hammer
- Bullish engulfing
- Morning star
Common bearish patterns include:
- Shooting star
- Bearish engulfing
- Evening star
These patterns become more reliable when combined with support, resistance, or trend analysis.
For example, a bullish engulfing candle near a strong support zone may suggest increasing buying pressure.
Step 5: Apply Technical Indicators
Indicators help traders confirm trends and momentum.
Some widely used indicators are:
Relative Strength Index (RSI)
RSI measures momentum and identifies overbought or oversold conditions.
- Above 70 may indicate overbought conditions.
- Below 30 may indicate oversold conditions.
MACD
The Moving Average Convergence Divergence indicator helps identify momentum shifts and trend changes.
Traders watch for:
- Signal line crossovers
- Histogram changes
- Divergence
Bollinger Bands
Bollinger Bands measure market volatility.
When bands expand, volatility increases. When they contract, volatility decreases.
Step 6: Understand Volume Analysis
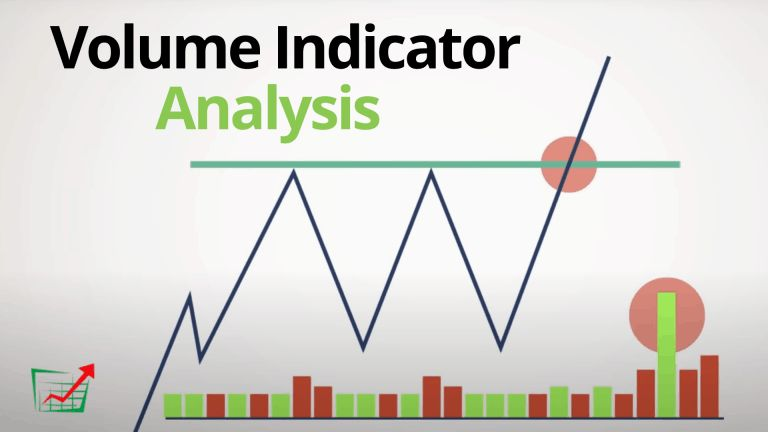
Volume represents the number of shares or contracts traded.
High volume often confirms strong market moves. For example:
- A breakout with strong volume may indicate genuine momentum.
- Weak volume may suggest a false breakout.
Volume analysis adds confirmation to technical analysis strategies.
Step 7: Develop Risk Management Rules
Even the best strategies fail sometimes. Therefore, risk management is essential.
Important risk management practices include:
- Setting stop-loss orders
- Avoiding oversized positions
- Maintaining realistic expectations
- Using proper risk-to-reward ratios
Many professional traders risk only a small percentage of their account on each trade.
Step 8: Backtest Your Strategy
Backtesting involves testing strategies using historical market data.
This process helps traders:
- Identify strengths and weaknesses
- Improve consistency
- Build confidence
- Refine entry and exit rules
A strategy that performs well historically may still fail in live markets, but testing helps improve preparation.
Step 9: Maintain Trading Discipline
Discipline is often the difference between successful and unsuccessful traders.
Traders should:
- Follow their trading plans
- Avoid emotional decisions
- Stay patient during uncertain conditions
- Accept losses calmly
Emotional trading usually leads to poor results.
Benefits of Technical Analysis Strategies
Technical analysis strategies offer several advantages for traders and investors.
- Helps identify trends early
- Improves trade timing
- Supports disciplined trading
- Works in multiple financial markets
- Provides clear entry and exit signals
- Helps reduce emotional trading
- Enhances risk management
- Allows short-term and long-term analysis
- Offers measurable trading rules
- Can be combined with fundamental analysis
Another major benefit is flexibility. Traders can adjust strategies based on their goals, experience, and preferred markets.
Technical analysis strategies also help traders stay organized. Instead of relying on opinions or social media hype, traders make decisions using structured analysis.
Disadvantages / Risks
Although technical analysis strategies are useful, they also have limitations and risks.
- No strategy guarantees profits
- False signals can occur frequently
- Indicators may lag behind price movement
- Emotional trading can still affect decisions
- Overcomplicated strategies may create confusion
- Market news can disrupt technical setups
- Beginners may misuse indicators
- Overtrading increases risk exposure
Another important issue is confirmation bias. Some traders only notice chart patterns that support their opinions while ignoring opposing signals.
Technical analysis strategies should never be treated as perfect prediction systems. Markets remain unpredictable, especially during major economic or political events.
Common Mistakes to Avoid
Many beginners struggle because they repeat common trading mistakes.
Ignoring Risk Management
Risk management is more important than finding the perfect indicator.
Without stop-loss protection, one bad trade can damage an entire account.
Using Too Many Indicators
Some traders overload charts with indicators.
This creates confusion and conflicting signals. Simpler strategies are often more effective.
Trading Without a Plan
Random trading decisions usually lead to inconsistent results.
A clear trading plan should include:
- Entry conditions
- Exit rules
- Risk limits
- Position size
Chasing the Market
Many traders enter late because they fear missing opportunities.
Buying after large price spikes often increases risk.
Ignoring Market Trends
Trading against strong trends can be dangerous.
Trend-following strategies generally provide higher probability setups.
Letting Emotions Control Decisions
Fear and greed are major trading enemies.
Successful traders remain calm and disciplined even during losses.
Unrealistic Expectations
Some beginners expect instant profits.
Trading requires continuous learning, patience, and practice.
FAQs
What are technical analysis strategies?
Technical analysis strategies are trading methods that use charts, indicators, price action, and market trends to predict future price movements. Traders use these strategies to improve decision-making in financial markets.
Are technical analysis strategies suitable for beginners?
Yes, beginners can learn technical analysis strategies gradually. Starting with basic concepts like trends, support, resistance, and moving averages helps build a strong foundation.
Which indicators are best for technical analysis?
Popular indicators include RSI, MACD, moving averages, and Bollinger Bands. However, no indicator is perfect. Traders often combine multiple tools for confirmation.
Can technical analysis predict the market perfectly?
No, technical analysis cannot guarantee perfect predictions. Markets are influenced by many factors, including economic news and investor psychology. Technical analysis only improves probability.
Is technical analysis better than fundamental analysis?
Both methods have advantages. Fundamental analysis studies financial health and economic conditions, while technical analysis focuses on price movement and timing. Many traders combine both approaches.
How long does it take to learn technical analysis?
Learning the basics may take a few months, but mastering technical analysis strategies can take years of practice and experience.
Can technical analysis strategies work in cryptocurrency trading?
Yes, technical analysis strategies are widely used in cryptocurrency markets because crypto prices are heavily influenced by market sentiment and volatility.
Why do traders use multiple timeframes?
Multiple timeframe analysis helps traders understand the bigger market picture while identifying precise entry points on smaller charts.
Expert Tips & Bonus Points
Experienced traders often follow habits that separate them from beginners.
Focus on Quality Trades
Taking fewer high-quality trades is usually better than constant trading.
Patience helps traders avoid unnecessary risks.
Keep a Trading Journal
A trading journal tracks:
- Entry reasons
- Exit reasons
- Emotions during trades
- Strategy performance
Reviewing past trades helps identify mistakes and improve future decisions.
Understand Market Psychology
Markets move because of collective emotions.
Understanding fear, greed, and crowd behavior improves chart interpretation.
Master One Strategy First
Many beginners jump between strategies too quickly.
Instead, traders should focus on mastering one approach before experimenting with others.
Protect Your Capital
Capital preservation is essential for long-term success.
Even professional traders experience losing streaks. Risk control keeps traders in the game.
Use Demo Accounts
Practice accounts allow traders to test technical analysis strategies without risking real money.
This builds confidence and improves execution skills.
Stay Updated on Market Conditions
Technical analysis works best when traders understand overall market conditions.
Major economic announcements, interest rate decisions, and global events can influence technical setups.
Maintain Emotional Balance
Successful traders remain emotionally stable.
Avoiding revenge trading and impulsive decisions improves consistency.
Conclusion
Technical analysis strategies play a major role in modern trading because they help traders analyze price movements, identify trends, and improve market timing. Instead of making emotional decisions, traders use structured methods based on charts, indicators, patterns, and market psychology.
Although technical analysis strategies cannot predict the future with complete accuracy, they provide valuable insights that improve trading probability. Understanding trends, support and resistance, candlestick patterns, volume, and technical indicators gives traders a stronger foundation for making informed decisions.
Beginners should focus on learning the basics slowly rather than trying to master everything at once. Simple strategies combined with strong risk management are often more effective than overly complicated systems. Patience, discipline, and continuous practice are equally important.
It is also essential to remember that losses are part of trading. Even experienced traders face losing trades regularly. The goal is not to win every trade but to manage risks wisely while maintaining consistency over time.
As financial markets continue evolving, technical analysis strategies remain valuable tools for traders across stocks, forex, cryptocurrencies, and commodities. By developing a clear trading plan, practicing disciplined execution, and improving market understanding, traders can build stronger confidence and make smarter trading decisions in the long run.